One problem that consistently GIS software has been unable to provide a solution to is when you need to plot the same map layout with a set of rasters. I imagine the main reason is that traditional GIS users do not encounter this problem1.
But in flood risk assessment, it is quite common to plot results at a certain location, and those results will vary. There will be different variables such as flood depths, water elevation or velocity. Each storm duration, event or scenario will produce a set of results to be plotted, and boy, they do add up quickly.
The results usually will share a legend, colour schemes and location. Only the layer containing the results will vary. We are in 2022 and yet no GIS software has an easy way to tell, hey you, iterate through this bunch of rasters and give some neat png instead.
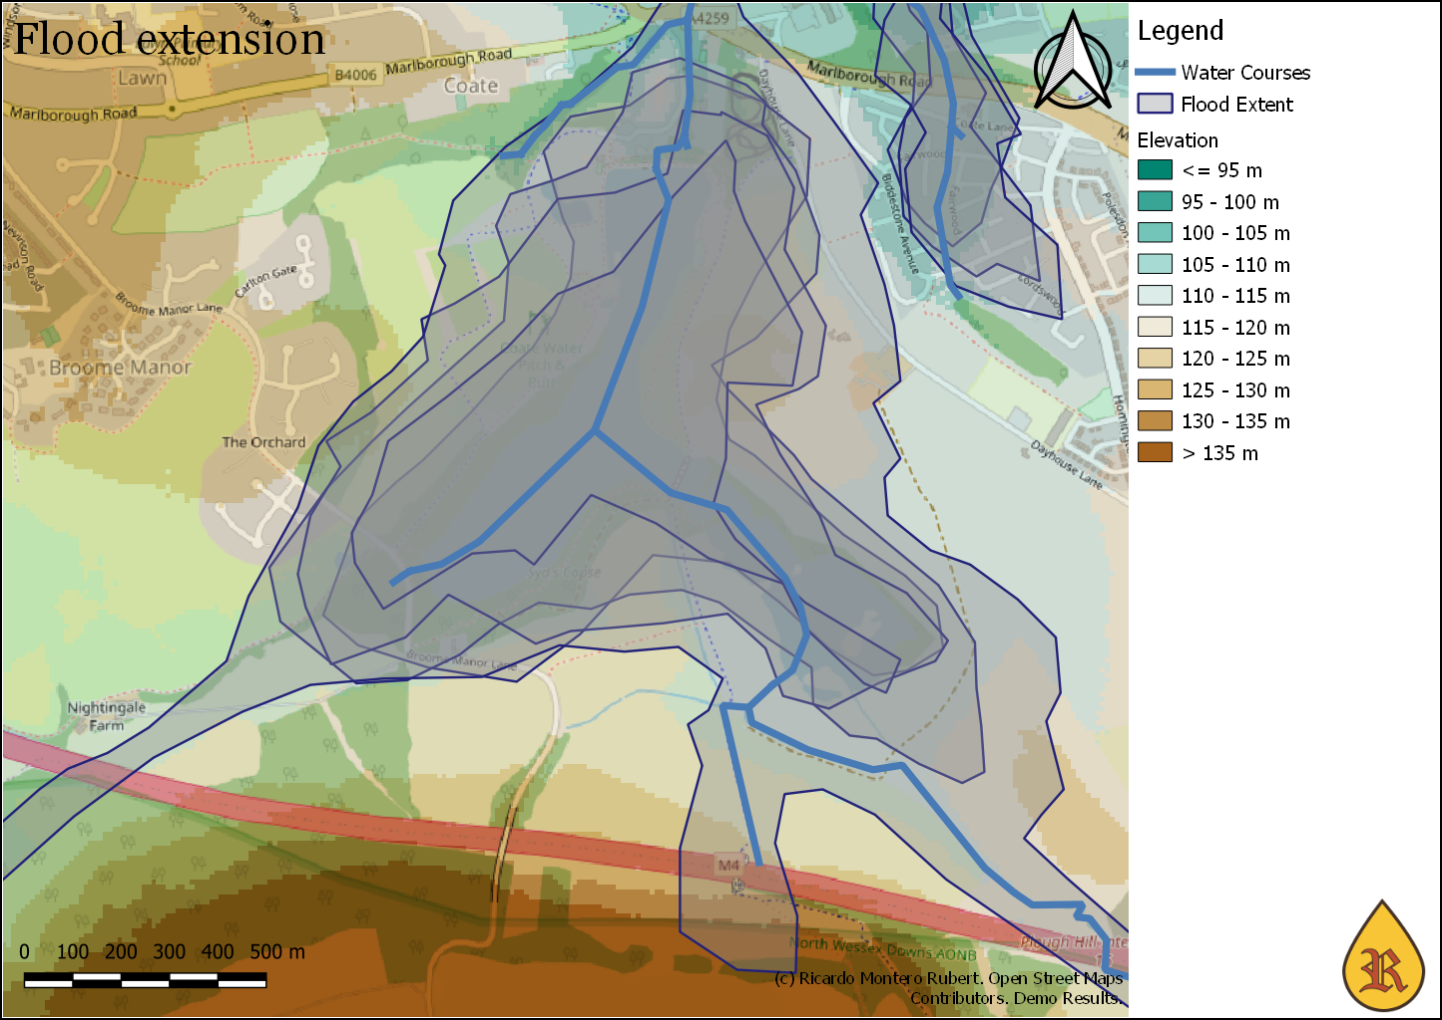
Figure 1: An example of what a messy a set of results can look like if plotted together
Someone needed to solve this hassle and looks like someone was me. In reality, this is the second time I have come up with a solution to this problem. My previous solution was based on R and ggplot. The plots looked neat, but the code was only understood by 3-years-ago-me. So this time I decided to go with Q-GIS and try to keep it simple. It also has the advantage that I don’t need to travel in time every time I want to use it.
Download
So here is the very first version of MultiLayout. Consists of a qgz workspace, a set of folders, a python script2, and a tsv3 file.
At the moment MultiLayout is quite clunky4 but I have decided to publish it as it is and keep upgrading according to the feedback I receive if I got any.
Instructions
It is actually more complex to explain than to do it.
Open the QGIS workspace and set all the common layers needed.
Background mapping, rivers shapefiles, etc…
Do not set yet the layers that the code will iterate to plot them.
Now open the master layout and modify it to your needs.
You might want to have a different layout for each variable
You need to configure the map view to the right location.
Configure the bar scale, north arrow, etc…
The title and disclaimer can be moved, but if they are deleted the code won’t work.
Make sure to configure the legend and leave it as a no-auto-update. I recommend using an invisible layer for this.
Save as a copy somewhere safe.
Open the file MultiLayout.tsv.txt which is a tab-separated file. I use Excel for that (drag and drop into excel)
ID: A number with the ID. Not used and can be empty,
Nraster: Not used and can be empty,
Nshp: Not used and can be empty,
ExportPath: The path where the png is going to be saved,
Title: The title text will be replaced with this cell,
Disclaimer: The disclaimer text will be replaced with this cell,
RasterPath_01: Path to the raster file that will be added on top of existing layers,
RasterStyle_01: The style that will be applied to the layer, and
Layout: The name of the layout that will be used, you should have one for each different variable.
Open Qgis and go to Plugins, then click on Python Console.
Click on the third button (Show Editor). On the editor, open the Script_01.py and modify lines 2 and 4.
Line 2 should point to the saved qgz.
Line 4 should point to the tsv.txt file.
Make sure the path is in between the quotes with an r before as in r”C:.ext”
Click on the green triangle to run the code. You should see the titles appear in the Python Console.
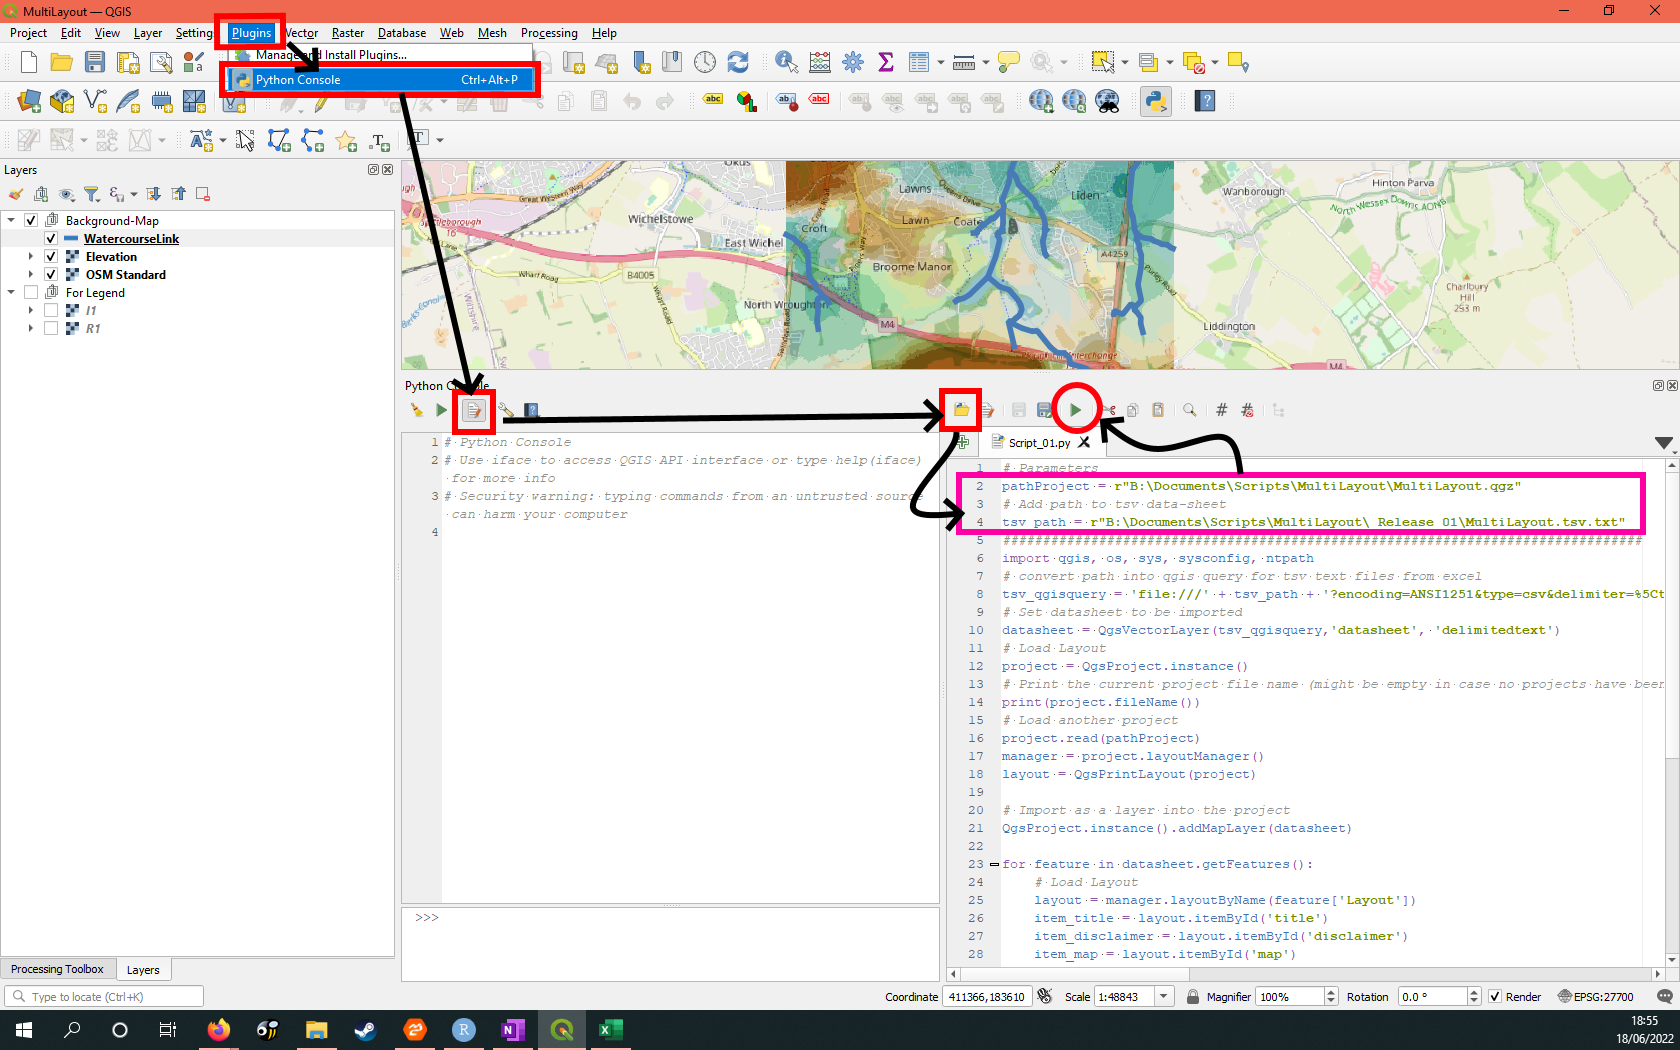
Figure 2: Steps four, five and six.
So what is next?
At the moment the script is rather basic. It is only able to add a raster layer per layout, and it will be always located on top of everything else. If I find it useful, I will try to make it more powerful. Ideally, I would like it to become a Q-GIS plugin if I find the time to do so.
If the maps are fairly distinct they won’t share a legend or scale, and each one should be on its own workspace. On the other hand, if you want to plot something like an elevation map or a land-type map, you will only need one map (per location).↩︎
Where the magic happens.↩︎
I have gone with a tab-separated file because I keep changing between Spanish and English layout where CSV is separated by “;” or “,”, and the tab solves this problem neatly.↩︎
and yet it is still light-years away than setting multiple layouts by yourself.↩︎