In the previous post, I rambled about how GIS software is not optimised at all to plot hydraulic results from simulations. Head over there if you are interested in the rambling, here I will present a different approach.
According to the last step of the Iñigo Montoya1 method for networking, I should be managing your expectations for this post. So what can you expect from reading this post?

Figure 1: Learning networking with Iñigo Montoya.
I would be expecting that you can export multiple layouts after reading this post. So don’t disappoint me. How? Well, this time we are using the functionality of the Jupyter notebook included in ArcGIS. They will allow us to export a batch of layouts, whilst switching on and off the visibility of the involved layers. The code is simple and with minimal Python knowledge, you should be able to tailor it to your own needs.
But first, what is a (Jupyter) notebook? A notebook is a way of presenting information where every piece of information (named cells) relies on previous pieces to advance to achieve whatever the purpose of the notebook is. Cells can contain images and text, but more importantly, they can contain snippets of code that will execute and show results.
My first contact with a notebook was as a student at Uni. I was using Wolfram Mathematica and it was a deal breaker. I could program an assignment, and if the teacher made up their mind before the delivery date. The only thing I need to do was to make the modification, run everything, and print it as a PDF. Boom! No more hours having to redo an assignment. On the other hand, being the only student using Mathematica made me an easy target to be tracked by professors.
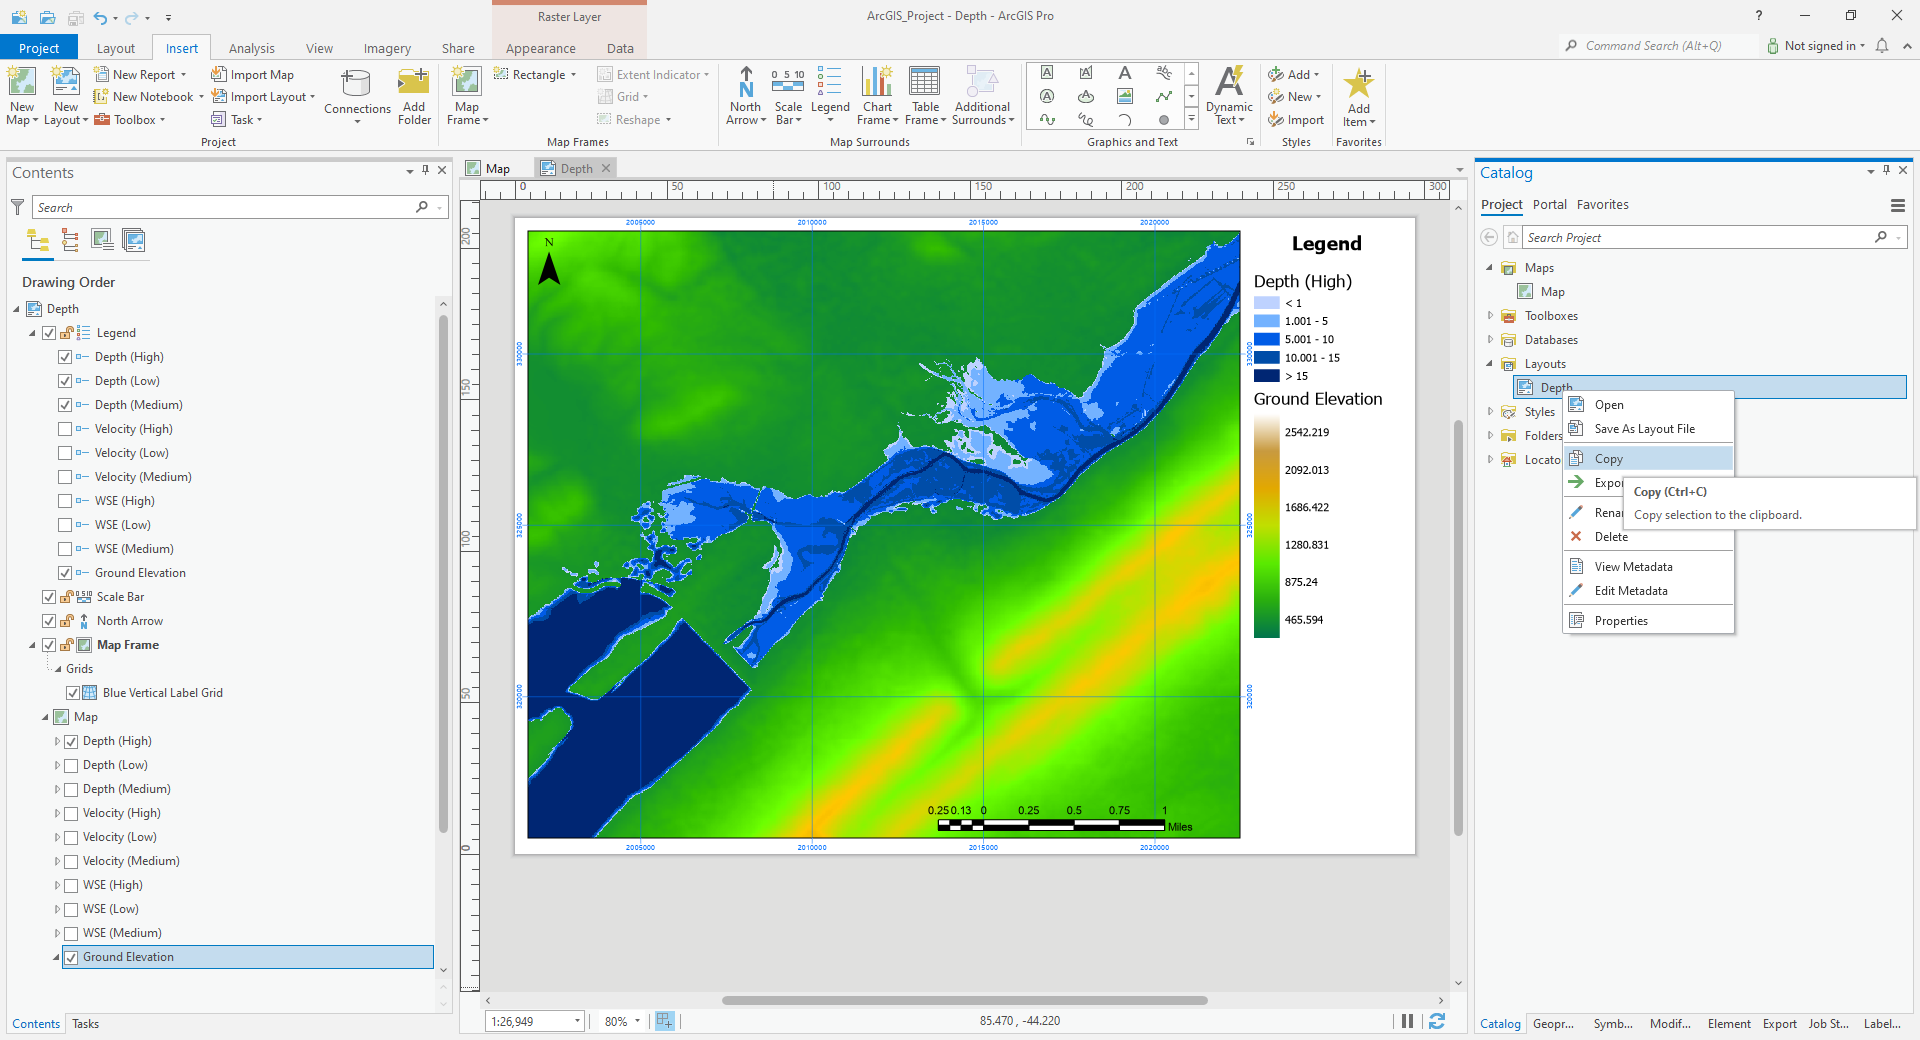
Figure 2: ArcGIS PRO, showing 1 map, and 1 layout (Depth).
To start you will need to have an ArcGIS project (.aprx) already set up. This means at least one map2, with one layout3 per variable4, the layers must have their symbology applied and all layouts and legends should be sorted out.
In my example, I have one map, with 9 layers. The 9 layers are results (Depth, Velocity and Water Surface Elevation) for hypothetical5 high, medium and low flows on Bald Eagle Creek.
Now we can proceed with the notebook. Open a new Jupyter notebook, this can be done in the Insert tab, New Notebook. Which in my case was in the third position starting on the left.
Notebook
You can download a copy of the Jupyter notebook here. You can download a copy of the whole ArcGIS project and layers used in the notebook here. For simplicity, each cell herewith has a little guidance.
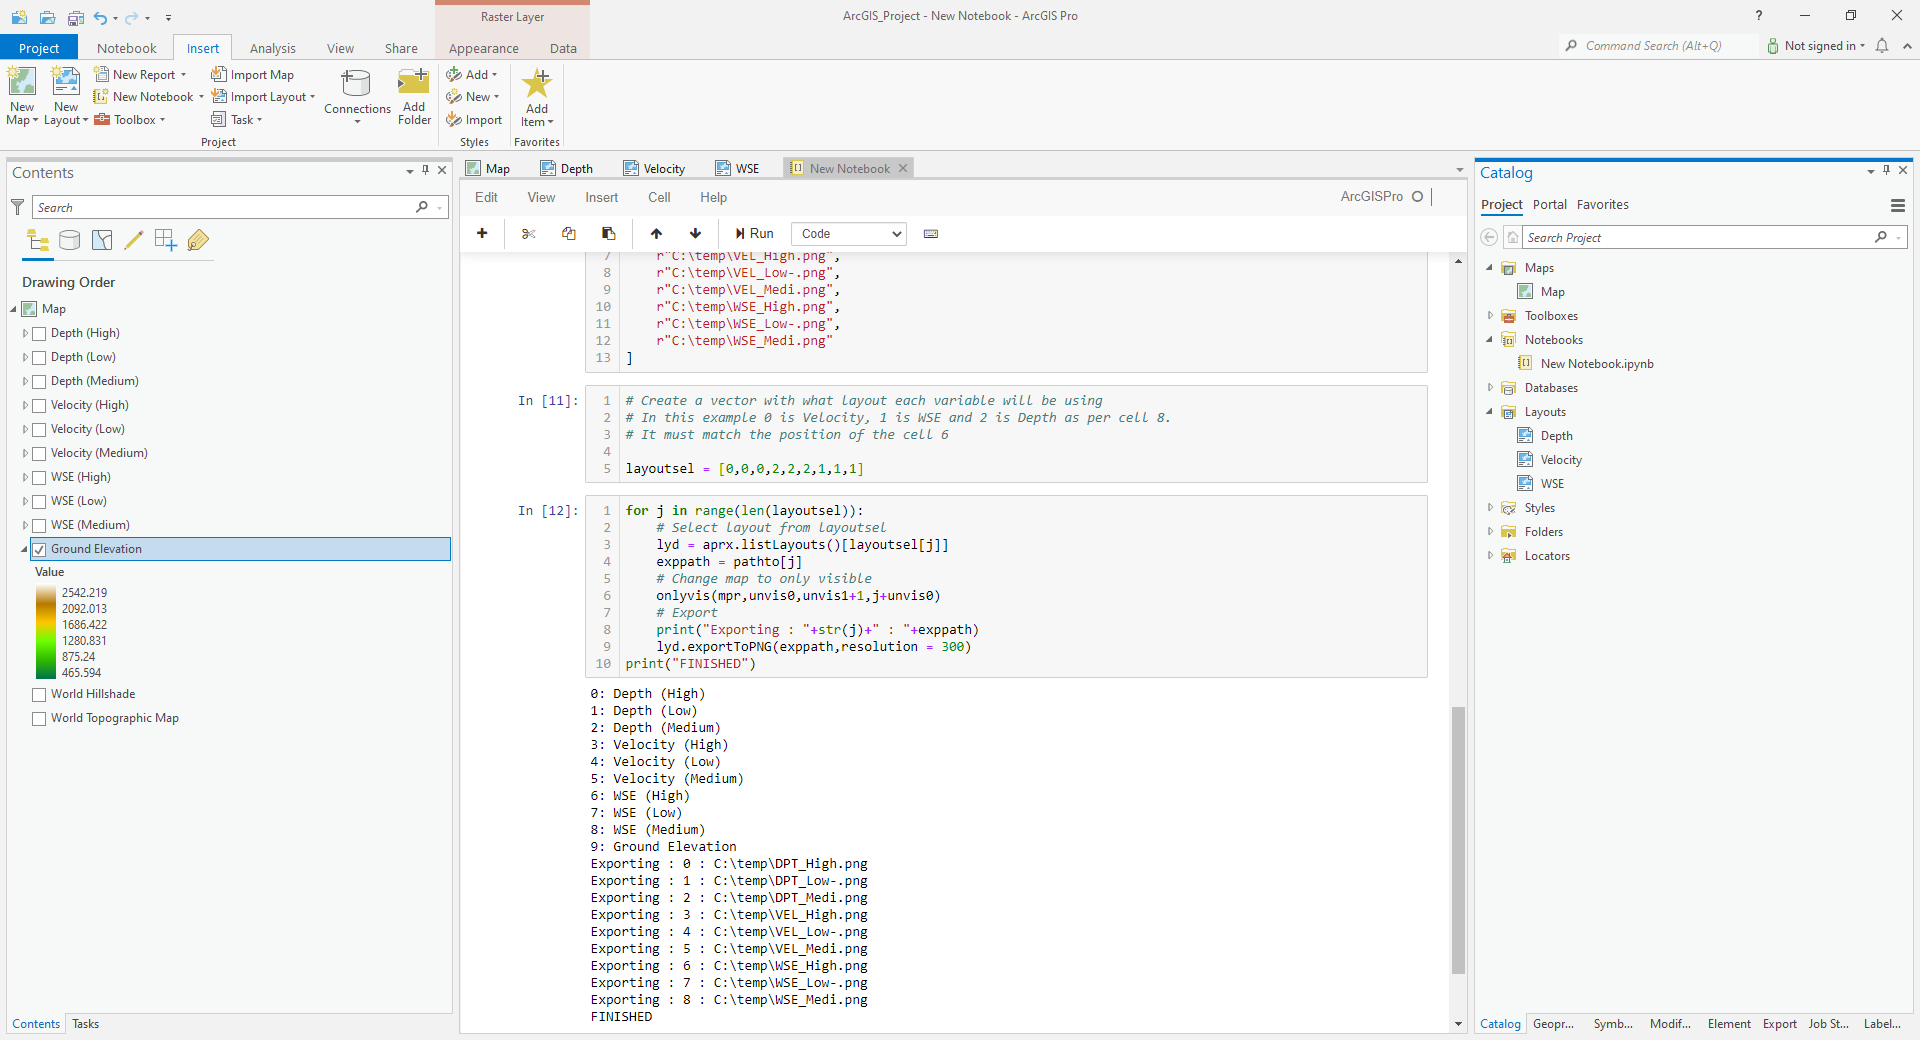
Figure 3: ArcGIS PRO screenshot, showing 1 map (Map), and 3 layouts (Depth, Velocity, WSE) and 9 layers from result plus another one for ground.
Cell 1: Select project
You should have only one project open. Order all your layers so that all variable layers (depth, velocity, etc…) are sitting together. I recommend ordering them following a pattern. Save the project, and whilst you run the Jupyter notebook refrain from adding, moving, editing or modifying anything in the project, but if you do, restart again from cell 1.
Code in:
# Save project before running this
aprx = arcpy.mp.ArcGISProject("CURRENT")
Cell 2: Show list of maps
We call a list of maps in the project saved at the variable aprx. In the loop, we print their location within the list. Mind that Python starts numbering lists (actually anything) on 0 instead of 1.
Code in:
# Show list of maps
aprx.listMaps()
i=0
for mp in aprx.listMaps():
    print( str(i)+": "+mp.name)
    i=i+1
Output:
0: MapCell 3: Select map you want to work with
We are working with one map. Select the map that you are interested in by its position on cell 2. For this example, the map should contain all layers.
Code in:
# Select the Map you want to work with
Select = 0
mpr = aprx.listMaps()[Select]
Output:
Cell 4: Show list of layers
As before we show a list with the layers contained in the map, and add their position to the list.
Code in:
# Show list of Layers
i=0
for m in mpr.listLayers():
    print( str(i) + ": "+ m.name )
    i=i+1
Output:
0: Depth (High)
1: Depth (Low)
2: Depth (Medium)
3: Velocity (High)
4: Velocity (Low)
5: Velocity (Medium)
6: WSE (High)
7: WSE (Low)
8: WSE (Medium)
9: Ground Elevation
10: World Hillshade
11: World Topographic Map
Cell 5: Select list of layers
If you don’t have all the layers ordered as a continuous group, do it now and return to cell 1. The idea is that you can select the raster as a couple of numbers. In this case, we are interested in switching through all layers from 0 to 8.
Code in:
# Select the boundaries of the layers to be changed
unvis0 = 0
unvis1 = 8
Output:
Cell 6: Show a list of layouts
We print a list of the layouts available in the project. We need to assign one layout to each layer in a future cell, so keep this list handy.
Code in:
# Show list of layouts
aprx.listLayouts()
i=0
for ly in aprx.listLayouts():
    print(str(i)+": "+ly.name)
    i=i+1
Output:
0: Velocity
1: WSE
2: Depth
Cell 7: Define the function
You need to run this cell, but you shouldn’t need to edit it, at least for this example. The function calls the map layer (mpr) and three integer such as \(novis0 \leq vis \leq novis1\). The function deactivates all layers in the range novis0-novis1, except for vis which always is active. This function will be called inside of a loop in a future cell.
Code in:
# Don't change anything in this function unless you know what are you doing
# But run the cell to define the function
def onlyvis(mpr,novis0,novis1,vis):
    # Makes everything invisible from novis0 to novis1 then makes vis visible in the mpr map
    i=novis0
    for m in mpr.listLayers()[novis0:novis1]:
        m.visible = False
        if (novis0==vis):
            print( str(i)+": "+m.name)
        i=i+1

    mpr.listLayers()[vis].visible = True
Output:
Cell 8: Create list with paths to were png will be written to
To define where the layout will be saved we create a vector of paths. The vector should have as many paths as layers are in the novis0-novis1 group. I have used raw strings to not have problems with backslashes ( \ ). Raw strings are created by placing an r in front of the first quotation mark. I like to use the column mode6 on notepad++ when working with paths, this is the reason why I have a strict policy of keeping the same number of characters at any cost.
Code in:
# Fill the list with the saving path, must be a raw string define as r"STRING"
# Remember it must match the position shown on cell 6.
pathto = [
    r"C:\temp\DPT_High.png",
    r"C:\temp\DPT_Low-.png",
    r"C:\temp\DPT_Medi.png",
    r"C:\temp\VEL_High.png",
    r"C:\temp\VEL_Low-.png",
    r"C:\temp\VEL_Medi.png",
    r"C:\temp\WSE_High.png",
    r"C:\temp\WSE_Low-.png",
    r"C:\temp\WSE_Medi.png"
]
Output:
Cell 9: Create list to assign a layout to each layer
Similarly, we need to create now a vector that selects the layout that will be used for each layer. The numbers on this vector should match the output on cell 6. Because the layer 0, 1, and 2 are velocity (layout=0), layers 3,4 and 5 are WSE (layout=2) and layers 6, 7 and 8 are Depth (layout=1). We need to build the vector below.
Code in:
# Create a vector with what layout each variable will be using
# In this example 0 is Velocity, 1 is WSE and 2 is Depth as per cell 8.
# It must match the position of the cell 6

layoutsel = [0,0,0,2,2,2,1,1,1]
Output:
Cell 10: Export all layers into PNG
Again, this is a piece of code you don’t need to edit. Just click on run and if you have done everything properly you should be getting the PNG at the desired (Cell 8) locations. It will overwrite anything that exists with that name, so don’t be clumsy!
Code in:
for j in range(len(layoutsel)):
    # Select layout from layoutsel
    lyd = aprx.listLayouts()[layoutsel[j]]
    exppath = pathto[j]
    # Change map to only visible
    onlyvis(mpr,unvis0,unvis1+1,j+unvis0)
    # Export
    print("Exporting : "+str(j)+" : "+exppath)
    lyd.exportToPNG(exppath,resolution = 300)
print("FINISHED")
Output:
0: Depth (High)
1: Depth (Low)
2: Depth (Medium)
3: Velocity (High)
4: Velocity (Low)
5: Velocity (Medium)
6: WSE (High)
7: WSE (Low)
8: WSE (Medium)
Exporting : 0 : C:\temp\DPT_High.png
Exporting : 1 : C:\temp\DPT_Low-.png
Exporting : 2 : C:\temp\DPT_Medi.png
Exporting : 3 : C:\temp\VEL_High.png
Exporting : 4 : C:\temp\VEL_Low-.png
Exporting : 5 : C:\temp\VEL_Medi.png
Exporting : 6 : C:\temp\WSE_High.png
Exporting : 7 : C:\temp\WSE_Low-.png
Exporting : 8 : C:\temp\WSE_Medi.png
FINISHED
No joke, it is a great method. I would like that any worker sent by my landlord present themselves with an SMS that actually contains the 4 steps within the SMS instead of “What time can I go on Tuesday?”↩︎
ArcGIS projects have maps and layouts. A map contains layers. Layouts usually will include at least one map.↩︎
Layouts show how the plot is printed, and likely you would need to configure one per variable, as the legends will be different for each variable.↩︎
A not obvious trick. You can copy and paste a layout from the catalogue menu, by right-clicking on it and pasting it into the parent folder.↩︎
Notice how in this example I explicitly avoid using units, return period or something similar. It is because everything shown here is just mock-up runs.↩︎
Column mode is activated by Shift+Alt+LeftMouseClick and at the same time drawing the cursor down.↩︎